
The Show Me panel has evolved to become even more intelligent, automatically suggesting optimal chart types based on your data’s characteristics and dimensionality. This feature alone can reduce visualization creation time by up to 70%, allowing analysts to focus on interpretation rather than technical implementation.
Advanced Tip: Leverage Tableau’s smart recommendations engine, which now uses machine learning to suggest not just chart types, but also data relationships and potential insights based on patterns in your dataset.
Revolutionary Data Integration Capabilities

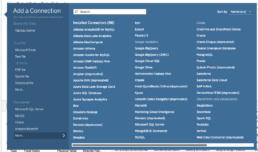
Modern Tableau Desktop supports over 100 native data connectors, from traditional databases to cloud platforms, APIs, and real-time streaming sources. The platform’s Hyper engine has transformed how users interact with large datasets, providing in-memory processing capabilities that handle billions of rows without performance degradation.
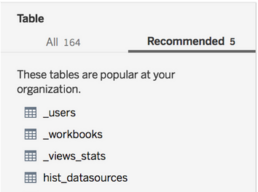
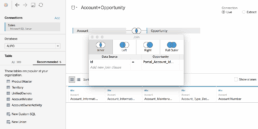
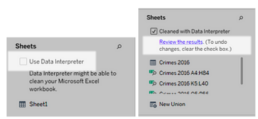
The enhanced Data Source page now includes intelligent data profiling that automatically detects data quality issues, suggests data types, and identifies relationships between tables. The Data Interpreter has become more sophisticated, using AI to understand complex data structures and automatically clean messy imports.
Pro Feature: The new relationship model allows for more flexible data modeling without the rigid join requirements of traditional approaches, enabling analysts to work with data in its natural state while maintaining analytical flexibility.

Enterprise-Grade Scalability with Personal Agility
Tableau Desktop seamlessly scales from individual exploration to enterprise deployment. The platform’s architecture supports everything from quick ad-hoc analysis to complex, multi-source dashboards that serve thousands of users.
Recent performance enhancements include:
- Hyper Extract Technology: Delivers query performance up to 10x faster than previous versions
- Federated Data Sources: Combine data from multiple sources without moving or copying data
- Advanced Analytics Integration: Native integration with R, Python, and statistical functions for sophisticated modeling
Interactive Dashboard Excellence
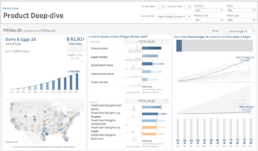
Tableau’s dashboard capabilities have evolved far beyond static reporting. Modern Tableau Desktop enables the creation of truly interactive experiences with features like:
- Dynamic Zone Visibility: Show and hide dashboard elements based on user selections
- Navigation Actions: Create guided analytical experiences with button-triggered navigation
- Parameter Actions: Enable users to interact directly with visualizations to drive parameter changes
- Advanced Filtering: Implement cascading filters and cross-dashboard filter actions
The Device Designer has been enhanced with responsive design capabilities, automatically adapting layouts for optimal viewing across desktop, tablet, and mobile platforms without requiring separate designs.
Advanced Analytics Integration
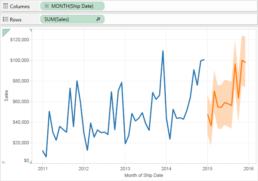
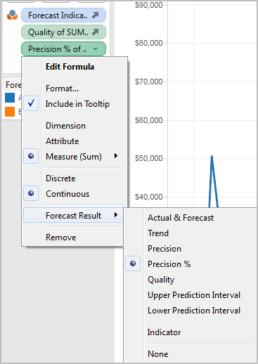
Tableau Desktop now includes native statistical functions and forecasting capabilities that rival specialized analytics tools. The platform supports:
- Built-in Statistical Functions: Correlation, regression, clustering, and trend analysis
- Predictive Analytics: Time series forecasting with confidence intervals
- What-If Analysis: Interactive scenario modeling with parameter controls
- Cohort Analysis: Built-in functions for customer retention and lifecycle analysis
Collaborative Intelligence Features
Tableau’s collaborative intelligence capabilities have evolved significantly with the integration of generative AI technology. These features are designed to democratize data analysis and help organizations reach the nearly 70% of employees who currently don’t use data tools for decision-making.

Natural Language Analytics: Ask Data functionality enables users to query their data using conversational language, with generative AI providing complex, human-like responses that make sophisticated analysis accessible to non-technical users.
AI-Powered Explanations: Explain Data leverages machine learning to automatically identify and explain factors behind unexpected values or trends in visualizations, providing contextual insights that accelerate understanding and decision-making.
Trust and Security: Built on Salesforce’s Einstein Trust Layer, these collaborative features maintain enterprise-grade security and privacy while delivering trusted, ethical AI experiences that administrators can confidently deploy across their organizations.
3. Mastering Tableau Desktop
Getting Started Strategically
While Tableau Desktop’s interface is intuitive, maximizing its potential requires understanding its underlying data workflow structure. The platform thinks in terms of dimensions (categorical data) and measures (quantitative data), and mastering this conceptual framework is key to creating effective visualizations.
Learning Path Recommendations:
- Master basic chart types and when to use them
- Understand calculated fields and their applications
- Learn dashboard design principles and user experience best practices
- Explore advanced analytics and statistical functions
- Develop expertise in data preparation and blending techniques
Advanced Techniques for Power Users
Modern Tableau Desktop includes sophisticated features for advanced practitioners:
- Level of Detail (LOD) Expressions: Perform calculations at different levels of granularity within the same visualization
- Table Calculations: Create complex analytics like running totals, percent differences, and rank calculations
- Set Actions: Enable dynamic grouping and highlighting based on user interactions
- Custom SQL: Write complex queries when standard connections aren’t sufficient
4. The Tableau Desktop Advantage in 2025
Performance Leadership
Tableau Desktop’s performance advantages have only grown stronger. The platform consistently handles larger datasets faster than alternatives, with the Hyper engine providing near-instantaneous response times even with complex calculations across millions of records.
Visualization Sophistication
The depth and breadth of Tableau’s visualization capabilities remain unmatched. From basic bar charts to complex geographic analyses with custom territories, density maps, and spatial calculations, Tableau Desktop provides the tools needed for any analytical challenge.
Community and Resources
Tableau’s vibrant community continues to be a significant advantage. The Tableau Public gallery showcases hundreds of thousands of visualizations, providing inspiration and learning opportunities. The annual Tableau Conference and active user groups ensure continuous learning and professional development opportunities.
Future-Ready Architecture
Tableau Desktop’s architecture positions it well for emerging trends in data analysis, including artificial intelligence integration, natural language processing, and automated insight generation. Recent updates demonstrate the platform’s commitment to staying at the forefront of data visualization innovation.
5. Making the Investment Decision
Version Considerations
Tableau Desktop offers the full power of the platform for individual users and small teams. For organizations requiring collaboration and governance features, Tableau Server or Tableau Cloud provide additional capabilities while maintaining the same core Desktop functionality.
The investment in Tableau Desktop pays dividends through:
- Reduced Time-to-Insight: Faster creation of analysis and visualizations
- Improved Decision Quality: Better data understanding through superior visualizations
- Enhanced Productivity: Streamlined workflows and automated processes
- Professional Development: Skills that translate across industries and roles
Conclusion
Tableau Desktop has evolved from a powerful visualization tool into a comprehensive analytics platform that serves the entire spectrum of data analysis needs. Its combination of ease-of-use, sophisticated capabilities, and robust performance makes it the clear choice for professionals serious about data visualization.
The platform’s continuous innovation, strong community support, and proven scalability ensure that choosing Tableau Desktop is not just a decision for today’s needs, but an investment in your organization’s analytical future. As data continues to grow in importance and complexity, having the right tools becomes increasingly critical to competitive advantage.
However, tools alone don’t guarantee success. The difference between basic chart creation and transformative data storytelling lies in proper training and expert guidance. Whether you’re creating your first dashboard or building enterprise-scale analytical solutions, combining Tableau Desktop’s capabilities with structured learning accelerates your journey to analytical excellence.