Module 6: Introduction to Working with Maps in Tableau
Online Course
Module 6: Introduction to Working with Maps in Tableau
Create Choropleth, Heat Maps, and Point Distribution Visualizations with Geographic Data.
Date and time
Oct 22, 2026
5 - 8 pm ET
Location
Live Online
Duration
3 hours
Cost
$349
About Module 6
Maps transform raw geographic data into compelling visual stories that reveal patterns impossible to see in traditional charts. In module 6, you’ll master geographic visualization in Tableau, learning to create diverse map types—from choropleth maps showing regional variations to heat maps revealing concentration patterns. You’ll explore fundamental mapping principles, prepare geographic data effectively, and discover advanced customization techniques using map layers and styling options to create professional maps that engage your audience and drive informed decision-making.
By the end of module 6, you will be able to:
- Understand mapping principles and when to use different map types
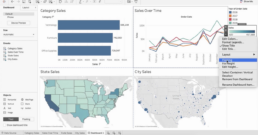
- Create various maps including choropleth, heat, and density maps
- Format geographic data properly for Tableau mapping
- Customize maps using layers and styling options
- Design effective maps that clearly communicate your data insights
“Good class, very informative and knowledgeable.” – Harrison F.
More testimonials
This 3-hour intensive session covers:
01
Mapping concepts and requirements
02
Creating visualization maps
03
Formatting maps

ABOUT THE INSTRUCTOR
FAYCAL BOUGUIR
Le Creative Lab Founder & Certified Tableau Instructor
Faycal, our founder is a certified Tableau instructor who combines years of industry experience with proven teaching methodologies. He provides expert guidance through hands-on exercises and real-world applications, ensuring you gain practical skills you can implement immediately.
Training details & requirements
Each 3-hour module combines interactive lectures with hands-on Tableau practice using our custom manual and step-by-step exercises. Sessions include Q&A periods and knowledge assessments in a small group format for personalized attention. Training is delivered live via Zoom with a 10-minute break and evaluation of learning outcomes at the end of each session.
Material Provided
- PDF Manual: Comprehensive course manual
- Step-by-step Exercise Instructions: Detailed practice guides
- Datasets: Real-world data for hands-on practice
- Post-training Support: 14-days online support after completion
Equipment needed
- Computer with a recent version of Tableau Desktop installed
- Reliable internet connection (for online sessions)
- Basic computer navigation skills
- Note-taking materials
Terms and conditions
Payment
Up to a maximum of 4 seats may be purchased per transaction. For larger numbers or corporate training please contact us. Payment can be made with all major credit cards through our secure system. You will be supplied with an automatic receipt. If you need to pay via bank transfer, by credit card over the phone, or via invoice please email us - we charge an additional 5% to cover time and logistics in these aspects of manual payment.
Discounts
At each session we offer a limited number of discount places. Students, educators, unemployed/those on benefits, people who work for NGOs/charities/educational organizations, and non-profit employees may pay discounted rates, while supplies last. Please contact us to request it. Note: people who work for commercial organizations pay full price. Book early as stocks are limited. Depending on availability we offer group discounts for multiple registrations - contact us for details.
Refunds and transfers
If you need to cancel your place we can offer a 100% refund up to five days before the session start date. You can request your refund by contacting us directly. Cancellation four or fewer days before the training results in 0% refund. Please allow up to 30 days for a refund to reach your account (usually sooner). If you wish to transfer your place to another name or to a future session, please contact us up to 24 hours before the session start date. Less than 24 hours before the session we cannot transfer your place.
Cancellations
In the event that we have to cancel the session, we will give you as much notice as possible and offer you the choice of either a full refund or an alternative session date. Our liability is limited to the participant registration fee.
Elevate your Tableau skills with Module 6
October sessions are now scheduled. Pre-register before August 31 and receive an exclusive 10% discount code for this module.
Inquire about our corporate training
We offer corporate customized training sessions and workshops as group and one-on-one options.
All our training is customized to meet your organization’s unique needs.

Module 5: Storytelling and Presentation of Tableau Visualizations
Online Course
Module 5: Storytelling and Presentation of Tableau Visualizations
Transform data insights into compelling narratives using design principles and storytelling techniques.
Date and time
Oct 20, 2026
5 - 8 pm ET
Location
Live Online
Duration
3 hours
Cost
$349
About Module 5
With module 5 you will learn to transform your data visualizations into compelling narratives that drive decision-making and audience engagement. You will master storytelling principles, graphic design fundamentals, and presentation methodologies specifically tailored for Tableau environments. The module guides you through constructing data-driven narratives, applying preattentive attributes and design principles, and curating visualizations for specific audiences.
By the end of module 5, you will be able to:
- Construct compelling data narratives that engage and impact your target audience
- Apply storytelling principles and storyboarding techniques to Tableau visualizations
- Implement design principles including color theory, typography, and layout optimization
- Curate and customize visualizations for specific audiences and accessibility needs
- Transform analytical insights into actionable presentations that drive decision-making
“Faycal ran this course very well and was able to present clearly and concisely with Zoom.“ – Jay S.
More testimonials
This 3-hour intensive session covers:
01
Introduction to storytelling
02
Storytelling process
03
Design principles for data visualization
ABOUT THE INSTRUCTOR
FAYCAL BOUGUIR
Le Creative Lab Founder & Certified Tableau Instructor
Faycal, our founder is a certified Tableau instructor who combines years of industry experience with proven teaching methodologies. He provides expert guidance through hands-on exercises and real-world applications, ensuring you gain practical skills you can implement immediately.
Training details & requirements
Each 3-hour module combines interactive lectures with hands-on Tableau practice using our custom manual and step-by-step exercises. Sessions include Q&A periods and knowledge assessments in a small group format for personalized attention. Training is delivered live via Zoom with a 10-minute break and evaluation of learning outcomes at the end of each session.
Material Provided
- PDF Manual: Comprehensive course manual
- Step-by-step Exercise Instructions: Detailed practice guides
- Datasets: Real-world data for hands-on practice
- Post-training Support: 14-days online support after completion
Equipment needed
- Computer with a recent version of Tableau Desktop installed
- Reliable internet connection (for online sessions)
- Basic computer navigation skills
- Note-taking materials
Terms and conditions
Payment
Up to a maximum of 4 seats may be purchased per transaction. For larger numbers or corporate training please contact us. Payment can be made with all major credit cards through our secure system. You will be supplied with an automatic receipt. If you need to pay via bank transfer, by credit card over the phone, or via invoice please email us - we charge an additional 5% to cover time and logistics in these aspects of manual payment.
Discounts
At each session we offer a limited number of discount places. Students, educators, unemployed/those on benefits, people who work for NGOs/charities/educational organizations, and non-profit employees may pay discounted rates, while supplies last. Please contact us to request it. Note: people who work for commercial organizations pay full price. Book early as stocks are limited. Depending on availability we offer group discounts for multiple registrations - contact us for details.
Refunds and transfers
If you need to cancel your place we can offer a 100% refund up to five days before the session start date. You can request your refund by contacting us directly. Cancellation four or fewer days before the training results in 0% refund. Please allow up to 30 days for a refund to reach your account (usually sooner). If you wish to transfer your place to another name or to a future session, please contact us up to 24 hours before the session start date. Less than 24 hours before the session we cannot transfer your place.
Cancellations
In the event that we have to cancel the session, we will give you as much notice as possible and offer you the choice of either a full refund or an alternative session date. Our liability is limited to the participant registration fee.
Elevate your Tableau skills with Module 5
October sessions are now scheduled. Pre-register before August 31 and receive an exclusive 10% discount code for this module.
Inquire about our corporate training
We offer corporate customized training sessions and workshops as group and one-on-one options.
All our training is customized to meet your organization’s unique needs.
Module 4: Calculations and Analysis Tools in Tableau
Online Course
Module 4: Calculations and Analysis Tools in Tableau
Build powerful formulas, table calculations, and analytical features for deeper insights.
Date and time
Oct 15, 2026
5 - 8 pm ET
Location
Live Online
Duration
3 hours
Cost
$349
About Module 4
With exercises focusing on calculations, module 4 introduces you to the various methods of working with the analysis menu and calculations in Tableau. You will create calculated fields using arithmetic, string, date, logical, and boolean functions, and leverage aggregation features to refine your analytical insights. The module covers advanced table calculations, custom formulas, and specialized visualization techniques including heat maps and highlight tables, enabling you to transform raw data into meaningful analytical outputs.
By the end of module 4, you will be able to:
- Create and edit calculated fields using arithmetic, string, date, logical, and boolean functions
- Apply aggregation and detail features to control the level of analysis
- Build custom table calculations and work with crosstab totals
- Handle null values and filter time periods effectively in your visualizations
- Design and format heat maps and highlight tables
“The content in the Tableau course will be valuable to apply in my current role. I look forward to using what I learned!” – William M.
More testimonials
This 3-hour intensive session covers:
01
Introduction to the analysis menu
02
Other types of calculations
03
Formatting and customizing tables
ABOUT THE INSTRUCTOR
FAYCAL BOUGUIR
Le Creative Lab Founder & Certified Tableau Instructor
Faycal, our founder is a certified Tableau instructor who combines years of industry experience with proven teaching methodologies. He provides expert guidance through hands-on exercises and real-world applications, ensuring you gain practical skills you can implement immediately.
Training details & requirements
Each 3-hour module combines interactive lectures with hands-on Tableau practice using our custom manual and step-by-step exercises. Sessions include Q&A periods and knowledge assessments in a small group format for personalized attention. Training is delivered live via Zoom with a 10-minute break and evaluation of learning outcomes at the end of each session.
Material Provided
- PDF Manual: Comprehensive course manual
- Step-by-step Exercise Instructions: Detailed practice guides
- Datasets: Real-world data for hands-on practice
- Post-training Support: 14-days online support after completion
Equipment needed
- Computer with a recent version of Tableau Desktop installed
- Reliable internet connection (for online sessions)
- Basic computer navigation skills
- Note-taking materials
Terms and conditions
Payment
Up to a maximum of 4 seats may be purchased per transaction. For larger numbers or corporate training please contact us. Payment can be made with all major credit cards through our secure system. You will be supplied with an automatic receipt. If you need to pay via bank transfer, by credit card over the phone, or via invoice please email us - we charge an additional 5% to cover time and logistics in these aspects of manual payment.
Discounts
At each session we offer a limited number of discount places. Students, educators, unemployed/those on benefits, people who work for NGOs/charities/educational organizations, and non-profit employees may pay discounted rates, while supplies last. Please contact us to request it. Note: people who work for commercial organizations pay full price. Book early as stocks are limited. Depending on availability we offer group discounts for multiple registrations - contact us for details.
Refunds and transfers
If you need to cancel your place we can offer a 100% refund up to five days before the session start date. You can request your refund by contacting us directly. Cancellation four or fewer days before the training results in 0% refund. Please allow up to 30 days for a refund to reach your account (usually sooner). If you wish to transfer your place to another name or to a future session, please contact us up to 24 hours before the session start date. Less than 24 hours before the session we cannot transfer your place.
Cancellations
In the event that we have to cancel the session, we will give you as much notice as possible and offer you the choice of either a full refund or an alternative session date. Our liability is limited to the participant registration fee.
Elevate your Tableau skills with Module 4
October sessions are now scheduled. Pre-register before August 31 and receive an exclusive 10% discount code for this module.
Inquire about our corporate training
We offer corporate customized training sessions and workshops as group and one-on-one options.
All our training is customized to meet your organization’s unique needs.
Module 3: Managing a Data Visualization Project in Tableau
Online Course
Module 3: Managing a Data Visualization Project in Tableau
Understand the Tableau ecosystem and implement effective project management workflows.
Date and time
Oct 13, 2026
5 - 8 pm ET
Location
Live Online
Duration
3 hours
Cost
$349
About Module 3
This module provides a comprehensive understanding of the Tableau ecosystem and project management strategies. You will explore the differences between Tableau products—including Tableau Cloud, Tableau Server, Tableau Desktop, Tableau Prep, and Tableau Reader—and learn how to select the right tools for your specific needs. The module introduces you to cutting-edge AI-powered features like Tableau Pulse and Tableau Agent, advanced data modeling with multi-fact relationships, and interactive Viz Extensions. You’ll master modern workflows, platform transitions, and best practices for structuring and managing successful data visualization projects from conception to deployment.
By the end of module 3, you will be able to:
- Navigate the Tableau applications and select the right tools for your needs
- Understand the latest Tableau features to enhance your visualizations
- Design efficient workflows across multiple platforms and data sources
- Manage data visualization projects from planning to deployment
- Transition from other analytics tools to maximize Tableau’s advantages
“Faycal did a great job–asking us questions, maintaining a pleasant and patient demeanor the whole time. Clearly knew the subject well whenever we asked questions.” – Bryce L.
More testimonials
This 3-hour intensive session covers:
01
Tableau as an ecosystem of applications
02
What's new in Tableau (latest features)
03
Workflows and transitioning from other tools
ABOUT THE INSTRUCTOR
FAYCAL BOUGUIR
Le Creative Lab Founder & Certified Tableau Instructor
Faycal, our founder is a certified Tableau instructor who combines years of industry experience with proven teaching methodologies. He provides expert guidance through hands-on exercises and real-world applications, ensuring you gain practical skills you can implement immediately.
Training details & requirements
Each 3-hour module combines interactive lectures with hands-on Tableau practice using our custom manual and step-by-step exercises. Sessions include Q&A periods and knowledge assessments in a small group format for personalized attention. Training is delivered live via Zoom with a 10-minute break and evaluation of learning outcomes at the end of each session.
Material Provided
- PDF Manual: Comprehensive course manual
- Step-by-step Exercise Instructions: Detailed practice guides
- Datasets: Real-world data for hands-on practice
- Post-training Support: 14-days online support after completion
Equipment needed
- Computer with a recent version of Tableau Desktop installed
- Reliable internet connection (for online sessions)
- Basic computer navigation skills
- Note-taking materials
Terms and conditions
Payment
Up to a maximum of 4 seats may be purchased per transaction. For larger numbers or corporate training please contact us. Payment can be made with all major credit cards through our secure system. You will be supplied with an automatic receipt. If you need to pay via bank transfer, by credit card over the phone, or via invoice please email us - we charge an additional 5% to cover time and logistics in these aspects of manual payment.
Discounts
At each session we offer a limited number of discount places. Students, educators, unemployed/those on benefits, people who work for NGOs/charities/educational organizations, and non-profit employees may pay discounted rates, while supplies last. Please contact us to request it. Note: people who work for commercial organizations pay full price. Book early as stocks are limited. Depending on availability we offer group discounts for multiple registrations - contact us for details.
Refunds and transfers
If you need to cancel your place we can offer a 100% refund up to five days before the session start date. You can request your refund by contacting us directly. Cancellation four or fewer days before the training results in 0% refund. Please allow up to 30 days for a refund to reach your account (usually sooner). If you wish to transfer your place to another name or to a future session, please contact us up to 24 hours before the session start date. Less than 24 hours before the session we cannot transfer your place.
Cancellations
In the event that we have to cancel the session, we will give you as much notice as possible and offer you the choice of either a full refund or an alternative session date. Our liability is limited to the participant registration fee.
Elevate your Tableau skills with Module 3
October sessions are now scheduled. Pre-register before August 31 and receive an exclusive 10% discount code for this module.
Inquire about our corporate training
We offer corporate customized training sessions and workshops as group and one-on-one options.
All our training is customized to meet your organization’s unique needs.
Module 2: Introduction to Tableau Interface and Tools
Online Course
Module 2: Introduction to Tableau Interface and Tools
Navigate Tableau's interface and create essential visualizations with professional formatting.
Date and time
Oct 8, 2026
5 - 8 pm ET
Location
Live Online
Duration
3 hours
Cost
$349
About Module 2
Module 2 offers a comprehensive introduction to the Tableau interface and tools. In this module, you will learn about Tableau terminology, including how to use data fields. You will create line charts, bar charts, stacked bar charts, treemaps, and scatter plots. You will be introduced to best practices for formatting your graphs for analysis and for your audience’s viewing, as well as methods to create visual hierarchy in your data visualizations.
By the end of module 2, you will be able to:
- Navigate the Tableau interface with confidence across all panels and tools
- Distinguish between dimensions and measures to build effective visualizations
- Create bar charts, line charts, treemaps, and scatter plots for different data scenarios
- Format visualizations professionally using colors, annotations, and tooltips
- Apply best practices to create clear visual hierarchy in your data stories
“Great experience working with Faycal. He provides clear instructions on how to use Tableau. It was a great learning experience as he customized the sample data to reflect our data.” – Julia B., HR & Operations Manager
More testimonials
This 3-hour intensive session covers:
01
Understanding the Tableau interface
02
Tableau terminology
03
Creating visualizations in Tableau
04
Formatting visualizations in Tableau
ABOUT THE INSTRUCTOR
FAYCAL BOUGUIR
Le Creative Lab Founder & Certified Tableau Instructor
Faycal, our founder is a certified Tableau instructor who combines years of industry experience with proven teaching methodologies. He provides expert guidance through hands-on exercises and real-world applications, ensuring you gain practical skills you can implement immediately.
Training details & requirements
Each 3-hour module combines interactive lectures with hands-on Tableau practice using our custom manual and step-by-step exercises. Sessions include Q&A periods and knowledge assessments in a small group format for personalized attention. Training is delivered live via Zoom with a 10-minute break and evaluation of learning outcomes at the end of each session.
Material Provided
- PDF Manual: Comprehensive course manual
- Step-by-step Exercise Instructions: Detailed practice guides
- Datasets: Real-world data for hands-on practice
- Post-training Support: 14-days online support after completion
Equipment needed
- Computer with a recent version of Tableau Desktop installed
- Reliable internet connection (for online sessions)
- Basic computer navigation skills
- Note-taking materials
Terms and conditions
Payment
Up to a maximum of 4 seats may be purchased per transaction. For larger numbers or corporate training please contact us. Payment can be made with all major credit cards through our secure system. You will be supplied with an automatic receipt. If you need to pay via bank transfer, by credit card over the phone, or via invoice please email us - we charge an additional 5% to cover time and logistics in these aspects of manual payment.
Discounts
At each session we offer a limited number of discount places. Students, educators, unemployed/those on benefits, people who work for NGOs/charities/educational organizations, and non-profit employees may pay discounted rates, while supplies last. Please contact us to request it. Note: people who work for commercial organizations pay full price. Book early as stocks are limited. Depending on availability we offer group discounts for multiple registrations - contact us for details.
Refunds and transfers
If you need to cancel your place we can offer a 100% refund up to five days before the session start date. You can request your refund by contacting us directly. Cancellation four or fewer days before the training results in 0% refund. Please allow up to 30 days for a refund to reach your account (usually sooner). If you wish to transfer your place to another name or to a future session, please contact us up to 24 hours before the session start date. Less than 24 hours before the session we cannot transfer your place.
Cancellations
In the event that we have to cancel the session, we will give you as much notice as possible and offer you the choice of either a full refund or an alternative session date. Our liability is limited to the participant registration fee.
Elevate your Tableau skills with Module 2
October sessions are now scheduled. Pre-register before August 31 and receive an exclusive 10% discount code for this module.
Inquire about our corporate training
We offer corporate customized training sessions and workshops as group and one-on-one options.
All our training is customized to meet your organization’s unique needs.

Exploring Data Analysis and Visualization with AI
Extracting meaningful insights from visual data is crucial to businesses. Artificial Intelligence is now transforming how we interpret and create data visualizations, making advanced analytics more accessible.
AI as Your Data Interpreter
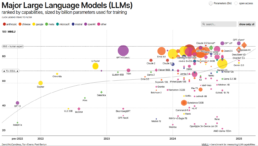
Recent advancements in Large Language Models (LLMs) have enabled AI systems to understand and analyze visual data representations with remarkable accuracy.
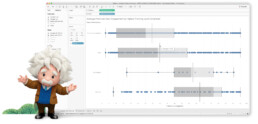
This capability means you can now upload charts, diagrams, and spreadsheets to AI assistants like ChatGPT and Claude, and receive instant analysis of the data presented. Whether it’s identifying trends in a line graph, highlighting anomalies in a scatter plot, or summarizing key insights from a complex dashboard, AI can provide meaningful additional interpretations in seconds.
What Can AI Understand About Graphs?
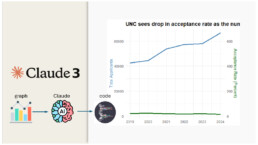
In a fascinating experiment documented by Michael Friendly & Claude Haiku, AI systems demonstrated their ability to:
– Accurately describe the core message and topic of data visualizations
– Identify key trends and numerical values from charts
– Recognize different chart types and their appropriate uses
– Suggest improvements to visualization design
Read more about the experiment in the following pdf:
https://github.com/friendly/AI-UNC-graph/blob/master/UNC-claude.pdf
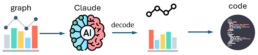
1. Creating Visualizations with AI
Beyond interpretation, some AI models can create compelling data visualizations:
- Code Generation: AI can write code in languages like R (with ggplot2) or Python to recreate or improve existing visualizations
- Design Recommendations: Suggest the most appropriate chart types for specific data relationships
- Visualization Enhancement: Recommend improvements to make data more understandable and visually appealing.
2. Current Limitations
While AI shows impressive capabilities, it still has a lot of room for improvement:
- Complex visualizations with multiple data sets can sometimes overwhelm AI systems
- AI may struggle with specialized domain knowledge needed to interpret certain graphs
- While it will give you a starting point, you will need to confirm any important points.
Looking Forward
The integration of AI into data analysis workflows is revolutionizing how organizations access insights. Today, business professionals without specialized data science backgrounds can easily extract meaningful information from visual data and create effective visualizations independently.
What data visualization tasks have you tried with AI tools? As a data visualization designer and trainer @ Le Creative Lab, I’ve witnessed firsthand how this democratization is cultivating more data-literate organizations, with visualization literacy emerging as an essential business skill. In the coming years, AI will likely become an indispensable supporting tool in data-driven decision making—automating routine analytical tasks while freeing human experts to focus on applying these insights to tackle complex business challenges and drive innovation.
Ready to upgrade your Data Viz skills?
Check out our comprehensive training programs on our learn page, or contact us to discuss customized corporate training solutions.
Module 1: Data Literacy, Data Connections and Working with Datasets
Online Course
Module 1: Data Literacy, Data Connections and Working with Datasets
Master data interpretation, structure, and multi-source connections in Tableau Desktop.
Date and time
Oct 6, 2026
5 - 8 pm ET
Location
Live Online
Duration
3 hours
Cost
$349
About Module 1
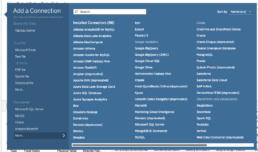
Module 1 offers an introduction to how Tableau interprets and structures data, and tools for working with datasets in Tableau including cleaning datasets with Tableau Prep, using the pivot, union, relationship and join features. In this module, you will gain a better understanding of how to use quantitative and qualitative data in Tableau, where to find relevant datasets, and best practices for utilizing your datasets in Tableau. This module also explains how to connect to multiple data sources in Tableau as well as differences in using live data and extract connections.
By the end of module 1, you will be able to:
- Connect to various data sources with confidence
- Edit and structure data to simplify your analysis process
- Apply a proven framework to different data scenarios in Tableau
- Choose appropriate data sources for your specific needs
- Combine multiple data sources for enhanced interpretation and insights
“The hands-on approach and comprehensive materials made complex Tableau concepts easy to understand and apply immediately.” – Amanda L.
More testimonials
This 3-hour intensive session covers:
01
Working with datasets
02
Data structure in Tableau
03
Connecting your data in Tableau
04
Modifying data structure
ABOUT THE INSTRUCTOR
FAYCAL BOUGUIR
Le Creative Lab Founder & Certified Tableau Instructor
Faycal, our founder is a certified Tableau instructor who combines years of industry experience with proven teaching methodologies. He provides expert guidance through hands-on exercises and real-world applications, ensuring you gain practical skills you can implement immediately.
Training details & requirements
Each 3-hour module combines interactive lectures with hands-on Tableau practice using our custom manual and step-by-step exercises. Sessions include Q&A periods and knowledge assessments in a small group format for personalized attention. Training is delivered live via Zoom with a 10-minute break and evaluation of learning outcomes at the end of each session.
Material Provided
- PDF Manual: Comprehensive course manual
- Step-by-step Exercise Instructions: Detailed practice guides
- Datasets: Real-world data for hands-on practice
- Post-training Support: 14-days online support after completion
Equipment needed
- Computer with a recent version of Tableau Desktop installed
- Reliable internet connection (for online sessions)
- Basic computer navigation skills
- Note-taking materials
Terms and conditions
Payment
Up to a maximum of 4 seats may be purchased per transaction. For larger numbers or corporate training please contact us. Payment can be made with all major credit cards through our secure system. You will be supplied with an automatic receipt. If you need to pay via bank transfer, by credit card over the phone, or via invoice please email us - we charge an additional 5% to cover time and logistics in these aspects of manual payment.
Discounts
At each session we offer a limited number of discount places. Students, educators, unemployed/those on benefits, people who work for NGOs/charities/educational organizations, and non-profit employees may pay discounted rates, while supplies last. Please contact us to request it. Note: people who work for commercial organizations pay full price. Book early as stocks are limited. Depending on availability we offer group discounts for multiple registrations - contact us for details.
Refunds and transfers
If you need to cancel your place we can offer a 100% refund up to five days before the session start date. You can request your refund by contacting us directly. Cancellation four or fewer days before the training results in 0% refund. Please allow up to 30 days for a refund to reach your account (usually sooner). If you wish to transfer your place to another name or to a future session, please contact us up to 24 hours before the session start date. Less than 24 hours before the session we cannot transfer your place.
Cancellations
In the event that we have to cancel the session, we will give you as much notice as possible and offer you the choice of either a full refund or an alternative session date. Our liability is limited to the participant registration fee.
Elevate your Tableau skills with Module 1
October sessions are now scheduled. Pre-register before August 31 and receive an exclusive 10% discount code for this module.
Inquire about our corporate training
We offer corporate customized training sessions and workshops as group and one-on-one options.
All our training is customized to meet your organization’s unique needs.
Why Tableau Desktop Remains the Premier Choice for Data Visualization
1. The Data Visualization Imperative
In today’s data-driven landscape, the ability to transform raw information into compelling visual narratives has become a critical business capability. Organizations generate unprecedented volumes of data and that has only accelerated in the past few years. Yet, the true value lies not in collection but in interpretation and communication. This is where Tableau Desktop distinguishes itself as the definitive platform for professional data visualization.
After years of evolution and refinement, Tableau Desktop has solidified its position as the industry standard for analysts, data scientists, and business professionals who demand both power and accessibility in their visualization tools.
2. Why Tableau Desktop Excels
Unmatched Speed and Intuitive Design
Tableau Desktop’s greatest strength lies in its ability to accelerate the journey from data to insight, providing you with a solid workflow. The platform’s drag-and-drop interface, combined with intelligent automation, enables you to create sophisticated visualizations in minutes rather than hours.

The Show Me panel has evolved to become even more intelligent, automatically suggesting optimal chart types based on your data’s characteristics and dimensionality. This feature alone can reduce visualization creation time by up to 70%, allowing analysts to focus on interpretation rather than technical implementation.
Advanced Tip: Leverage Tableau’s smart recommendations engine, which now uses machine learning to suggest not just chart types, but also data relationships and potential insights based on patterns in your dataset.
Revolutionary Data Integration Capabilities

Modern Tableau Desktop supports over 100 native data connectors, from traditional databases to cloud platforms, APIs, and real-time streaming sources. The platform’s Hyper engine has transformed how users interact with large datasets, providing in-memory processing capabilities that handle billions of rows without performance degradation.
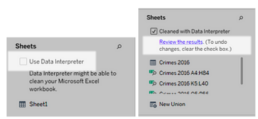
The enhanced Data Source page now includes intelligent data profiling that automatically detects data quality issues, suggests data types, and identifies relationships between tables. The Data Interpreter has become more sophisticated, using AI to understand complex data structures and automatically clean messy imports.
Pro Feature: The new relationship model allows for more flexible data modeling without the rigid join requirements of traditional approaches, enabling analysts to work with data in its natural state while maintaining analytical flexibility.

Enterprise-Grade Scalability with Personal Agility
Tableau Desktop seamlessly scales from individual exploration to enterprise deployment. The platform’s architecture supports everything from quick ad-hoc analysis to complex, multi-source dashboards that serve thousands of users.
Recent performance enhancements include:
- Hyper Extract Technology: Delivers query performance up to 10x faster than previous versions
- Federated Data Sources: Combine data from multiple sources without moving or copying data
- Advanced Analytics Integration: Native integration with R, Python, and statistical functions for sophisticated modeling
Interactive Dashboard Excellence
Tableau’s dashboard capabilities have evolved far beyond static reporting. Modern Tableau Desktop enables the creation of truly interactive experiences with features like:
- Dynamic Zone Visibility: Show and hide dashboard elements based on user selections
- Navigation Actions: Create guided analytical experiences with button-triggered navigation
- Parameter Actions: Enable users to interact directly with visualizations to drive parameter changes
- Advanced Filtering: Implement cascading filters and cross-dashboard filter actions
The Device Designer has been enhanced with responsive design capabilities, automatically adapting layouts for optimal viewing across desktop, tablet, and mobile platforms without requiring separate designs.
Advanced Analytics Integration
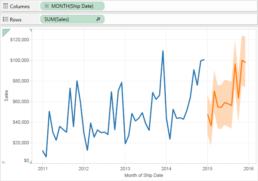
Tableau Desktop now includes native statistical functions and forecasting capabilities that rival specialized analytics tools. The platform supports:
- Built-in Statistical Functions: Correlation, regression, clustering, and trend analysis
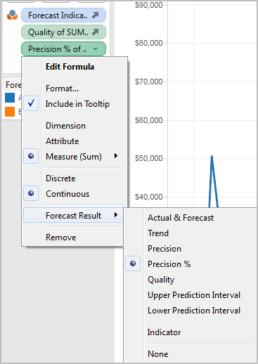
- Predictive Analytics: Time series forecasting with confidence intervals
- What-If Analysis: Interactive scenario modeling with parameter controls
- Cohort Analysis: Built-in functions for customer retention and lifecycle analysis
Collaborative Intelligence Features
Tableau’s collaborative intelligence capabilities have evolved significantly with the integration of generative AI technology. These features are designed to democratize data analysis and help organizations reach the nearly 70% of employees who currently don’t use data tools for decision-making.

Natural Language Analytics: Ask Data functionality enables users to query their data using conversational language, with generative AI providing complex, human-like responses that make sophisticated analysis accessible to non-technical users.
AI-Powered Explanations: Explain Data leverages machine learning to automatically identify and explain factors behind unexpected values or trends in visualizations, providing contextual insights that accelerate understanding and decision-making.
Trust and Security: Built on Salesforce’s Einstein Trust Layer, these collaborative features maintain enterprise-grade security and privacy while delivering trusted, ethical AI experiences that administrators can confidently deploy across their organizations.
3. Mastering Tableau Desktop
Getting Started Strategically
While Tableau Desktop’s interface is intuitive, maximizing its potential requires understanding its underlying data workflow structure. The platform thinks in terms of dimensions (categorical data) and measures (quantitative data), and mastering this conceptual framework is key to creating effective visualizations.
Learning Path Recommendations:
- Master basic chart types and when to use them
- Understand calculated fields and their applications
- Learn dashboard design principles and user experience best practices
- Explore advanced analytics and statistical functions
- Develop expertise in data preparation and blending techniques
Advanced Techniques for Power Users
Modern Tableau Desktop includes sophisticated features for advanced practitioners:
- Level of Detail (LOD) Expressions: Perform calculations at different levels of granularity within the same visualization
- Table Calculations: Create complex analytics like running totals, percent differences, and rank calculations
- Set Actions: Enable dynamic grouping and highlighting based on user interactions
- Custom SQL: Write complex queries when standard connections aren’t sufficient
4. The Tableau Desktop Advantage in 2025
Performance Leadership
Tableau Desktop’s performance advantages have only grown stronger. The platform consistently handles larger datasets faster than alternatives, with the Hyper engine providing near-instantaneous response times even with complex calculations across millions of records.
Visualization Sophistication
The depth and breadth of Tableau’s visualization capabilities remain unmatched. From basic bar charts to complex geographic analyses with custom territories, density maps, and spatial calculations, Tableau Desktop provides the tools needed for any analytical challenge.
Community and Resources
Tableau’s vibrant community continues to be a significant advantage. The Tableau Public gallery showcases hundreds of thousands of visualizations, providing inspiration and learning opportunities. The annual Tableau Conference and active user groups ensure continuous learning and professional development opportunities.
Future-Ready Architecture
Tableau Desktop’s architecture positions it well for emerging trends in data analysis, including artificial intelligence integration, natural language processing, and automated insight generation. Recent updates demonstrate the platform’s commitment to staying at the forefront of data visualization innovation.
5. Making the Investment Decision
Version Considerations
Tableau Desktop offers the full power of the platform for individual users and small teams. For organizations requiring collaboration and governance features, Tableau Server or Tableau Cloud provide additional capabilities while maintaining the same core Desktop functionality.
The investment in Tableau Desktop pays dividends through:
- Reduced Time-to-Insight: Faster creation of analysis and visualizations
- Improved Decision Quality: Better data understanding through superior visualizations
- Enhanced Productivity: Streamlined workflows and automated processes
- Professional Development: Skills that translate across industries and roles
Conclusion
Tableau Desktop has evolved from a powerful visualization tool into a comprehensive analytics platform that serves the entire spectrum of data analysis needs. Its combination of ease-of-use, sophisticated capabilities, and robust performance makes it the clear choice for professionals serious about data visualization.
The platform’s continuous innovation, strong community support, and proven scalability ensure that choosing Tableau Desktop is not just a decision for today’s needs, but an investment in your organization’s analytical future. As data continues to grow in importance and complexity, having the right tools becomes increasingly critical to competitive advantage.
However, tools alone don’t guarantee success. The difference between basic chart creation and transformative data storytelling lies in proper training and expert guidance. Whether you’re creating your first dashboard or building enterprise-scale analytical solutions, combining Tableau Desktop’s capabilities with structured learning accelerates your journey to analytical excellence.
Ready to master Tableau?
Visit our learn page to explore our comprehensive training programs, or contact us to discuss customized corporate training solutions.

How to Trust your Intuition when You're Making a Decision
Once I gave the headphones a thorough once-over exam, I tried them on. As I mentioned, they have a classic over-the-ear style and just looking at them, the padding on the ear pieces seem adequate and the peak of the headband seemed to be a bit lacking, but you don’t really know comfort unless you try on the product. So, I slipped the headphones on and found them to be exquisitely comfortable. Once I gave the headphones a thorough once-over exam, I tried them on. As I mentioned, they have a classic over-the-ear style and just looking at them, the padding on the ear pieces seem adequate and the peak of the headband seemed to be a bit lacking, but you don’t really know comfort unless you try on the product. So, I slipped the headphones on and found them to be exquisitely comfortable.
If no one hates you, no one is paying attention. If attention is what you want for vanity, confidence, or, hell — to make a decent living — then know that it’s not instantaneous. Every single person that you’re currently paying attention to, at some point in their lives.
You need to be true to yourself
Just like every other human on the planet, I have epically awesome days and days when life just turne against me. And while I can’t stand most self-help (see: tired quotes over stock photography on Instagram), sometimes I need a little pick-me-up. And most of the time, in order to get out of a slump (because my brain leans more into math/science than anything else), I need to drop a logic bomb on my ass.
Yes, this is a long article. But here’s the thing — if you’re reading this in your inbox and are already like, “fuck this!” delete it. No hard feelings. If you’re reading this in a browser on a website, and you see how tiny the scroll-bar is because of how far you still have to scroll to get to the bottom, close this tab and go back to 140-character tidbits of advice. Still with me? Phew. Just had to weed out all the folks from points: #1, #4 and #8. Welcome friends, onward we go.

Never give up and stay strong
If no one hates you, no one is paying attention. If attention is what you want for vanity, confidence, or, hell — to make a decent living — then know that it’s not instantaneous. Every single person that you’re currently paying attention to, at some point in their lives, was in your exact position. They kept at it and worked enough so that others started listening. Also know that if no one is watching, you can experience true freedom. Dance in your underwear. Write entirely for yourself. Like there’s a going-out-of-business sale. Find yourself — not in some coming-of-age hippie way involving pasta and ashrams— but in a way that helps you draw your own line in the sand for what matters and what doesn’t. Do what you want to do, just because you want to do that thing. This will build confidence that will come in handy later.


Once I gave the headphones a thorough once-over exam, I tried them on. As I mentioned, they have a classic over-the-ear style and just looking at them, the padding on the ear pieces seem adequate and the peak of the headband seemed to be a bit lacking, but you don’t really know comfort unless you try on the product. So, I slipped the headphones on and found them to be exquisitely comfortable. Once I gave the headphones a thorough once-over exam, I tried them on. As I mentioned, they have a classic over-the-ear style and just looking at them, the padding on the ear pieces seem adequate and the peak of the headband seemed to be a bit lacking, but you don’t really know comfort unless you try on the product. So, I slipped the headphones on and found them to be exquisitely comfortable.
If no one hates you, no one is paying attention. If attention is what you want for vanity, confidence, or, hell — to make a decent living — then know that it’s not instantaneous. Every single person that you’re currently paying attention to, at some point in their lives, was in your exact position. They kept at it and worked enough so that others started listening. Also know that if no one is watching, you can experience true freedom. Dance in your underwear. Write entirely for yourself. Like there’s a going-out-of-business sale. Find yourself — not in some coming-of-age hippie way involving pasta and ashrams— but in a way that helps you draw your own line in the sand for what matters and what doesn’t. Do what you want to do, just because you want to do that thing. This will build confidence that will come in handy later.

Everyday inspired by the Beauty of the Mountains
Take your time.
I’ve got a Fujifilm X100s. It runs about $1300. It’s easily the best camera I’ve ever owned. I take care of it as best as I can, but I don’t let taking care of it impact the photography. Let me elaborate on that a bit better. You’ll get better at each section of what we talked about slowly. And while you do, you’ll be amazed at how much easier it all is and how the habit forms. The best way to get better at photography is start by taking your camera everywhere. If you leave your house, your camera leaves with you. The only exception is if you’re planning for a weekend bender — then probably leave it at home. Other than that, always have it slung over your shoulder. It would probably help to get an extra battery to carry in your pocket. I’ve got three batteries. One in my camera, one in my pocket, one in the charger.
When it dies, swap them all.
For me, the most important part of improving at photography has been sharing it. Sign up for an Exposure account, or post regularly to Tumblr, or both. Tell people you’re trying to get better at photography. Talk about it. When you talk about it, other people get excited about it. They’ll come on photo walks with you. They’ll pose for portraits. They’ll buy your prints, zines, whatever.
Clouds come floating into my life, no longer to carry rain or usher storm, my sunset sky.
— Rabindranath Tagore
Breathe the world.
I’ve got a Fujifilm X100s. It’s easily the best camera I’ve ever owned. I take care of it as best as I can, but I don’t let taking care of it impact the photography. Let me elaborate on that a bit better. You’ll get better at each section of what we talked about slowly. And while you do, you’ll be amazed at how much easier it all is and how the habit forms. The best way to get better at photography is start by taking your camera everywhere. If you leave your house, your camera leaves with you. The only exception is if you’re planning for a weekend bender — then probably leave it at home. Other than that, always have it slung over your shoulder. It would probably help to get an extra battery to carry in your pocket. I’ve got three batteries. One in my camera, one in my pocket, one in the charger. When it dies, swap them all.
For me, the most important part of improving at photography has been sharing it. Sign up for an Exposure account, or post regularly to Tumblr, or both. Tell people you’re trying to get better at photography. Talk about it. When you talk about it, other people get excited about it. They’ll come on photo walks with you. They’ll pose for portraits. They’ll buy your prints, zines, whatever.
Heavy hearts, like heavy clouds in the sky, are best relieved by the letting of a little water.
— Christopher Morley
Enjoy the morning.
The best way to get better at photography is start by taking your camera everywhere. If you leave your house, your camera leaves with you. The only exception is if you’re planning for a weekend bender — then probably leave it at home. Other than that, always have it slung over your shoulder. It would probably help to get an extra battery to carry in your pocket. I’ve got three batteries. One in my camera, one in my pocket, one in the charger. When it dies, swap them all.
For me, the most important part of improving at photography has been sharing it. Sign up for an Exposure account, or post regularly to Tumblr, or both. Tell people you’re trying to get better at photography. Talk about it. When you talk about it, other people get excited about it. They’ll come on photo walks with you. They’ll pose for portraits. They’ll buy your prints, zines, whatever.
It’s easily the best camera I’ve ever owned. I take care of it as best as I can, but I don’t let taking care of it impact the photography. You’ll get better at each section of what we talked about slowly. And while you do, you’ll be amazed at how much easier it all is and how the habit forms.
There are absolutely no rules of architecture for a castle in the clouds and this is real.
— Gilbert K. Chesterton
Free your mind.
The best way to get better at photography is start by taking your camera everywhere. If you leave your house, your camera leaves with you. The only exception is if you’re planning for a weekend bender — then probably leave it at home. Other than that, always have it slung over your shoulder. It would probably help to get an extra battery to carry in your pocket. I’ve got three batteries. One in my camera, one in my pocket, one in the charger. When it dies, swap them all.
I’ve got a Fujifilm X100s. It’s easily the best camera I’ve ever owned. I take care of it as best as I can, but I don’t let taking care of it impact the photography. Let me elaborate on that a bit better. You’ll get better at each section of what we talked about slowly. And while you do, you’ll be amazed at how much easier it all is and how the habit forms.
For me, the most important part of improving at photography has been sharing it. Sign up for an Exposure account, or post regularly to Tumblr, or both. Tell people you’re trying to get better at photography. Talk about it. When you talk about it, other people get excited about it. They’ll come on photo walks with you. They’ll pose for portraits. They’ll buy your prints, zines, whatever.